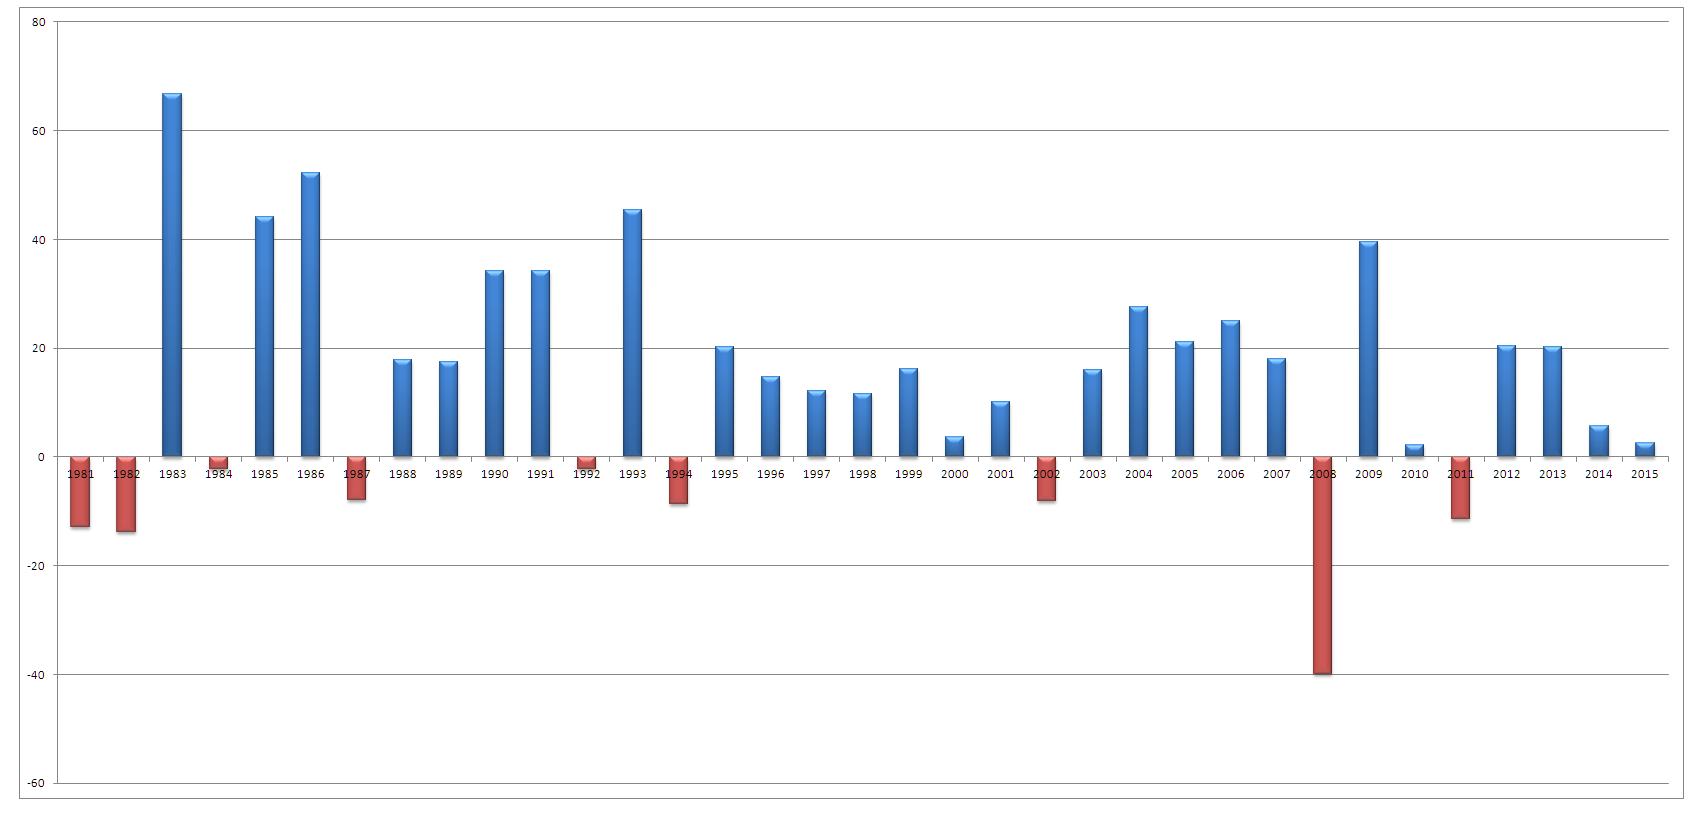
I have cobbled together a few dodgy sources to build a 35 year graph of the total returns (includes dividends) for the ASX 200. The S&P/ASX 200 only came into being in 2000 so some of the data is of a composite nature. The thing that is always interesting about this is how little damage the 1987 crash actually did.
Thanks Chris it fascinates me how perception never matches reality
What is also interesting is that the market was down 40% in the year of the GFC and up 40% the following year plus 2 further years of + 20% returns and we are still yet to surpass the highs achieved pre-GFC in Australia. Illustrates how hard it is to come back from such a big negative hit.
Comments are closed.
Hi there! My name is Stockbot
Chat to Stockbot Your Trusted Mentor Program Expert
I'm your go-to-expert for all things related to our exceptional Trading Game Mentor Program. So don't hold back, ask me questions about the course. And remember, being patient is key as my AI bot skills need time to find you the right answer.
Also, don't forget to register for Priority Notification for the Mentor Program and get a whole heap of free trading resources.
To get that done, go to this link:
https://www.tradinggame.com/priority
Hi there! My name is Stockbot and I'm here to answer any questions you may have about The Trading Game Mentor Program. Is there anything specific you'd like to know about the program? Remember, if you haven't already, be sure to register for Priority Notification at this link: https://www.tradinggame.com.au/priority/
Thanks Chris it fascinates me how perception never matches reality
What is also interesting is that the market was down 40% in the year of the GFC and up 40% the following year plus 2 further years of + 20% returns and we are still yet to surpass the highs achieved pre-GFC in Australia. Illustrates how hard it is to come back from such a big negative hit.